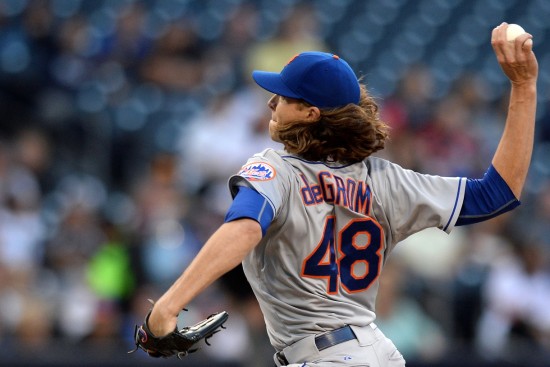

Stat Line: 8 IP, 0 R, 8 K’s, 0 BB
Jacob deGrom kept it simple in another sensational outing Monday night against the San Diego Padres. Just as he did in his last two DeGrominant outings, deGrom continued to attack opposing hitters with his fastball, throwing a fastball on over 67% of his pitches. Additionally, deGrom’s fastball lead to outs in 18 of the 24 Padres batters that he retired (I included the eighth inning soft groundball error/infield hit to Wilmer Flores). The high fastball rate could be contributed to deGrom pitching with a decent lead from the fifth inning through eighth innings. More likely the high fastball rate was a product of deGrom discovering and continually exposing the lack of ability the Padres hitters have in making solid contact against his fastball.
As MLB pitchers find a rhythm during the course of a game, they begin to pattern their pitches or throw their pitches in the same sequence. Opposing hitters usually pick up on this pattern by the second or third time through the batting order which tends to correlate with MLB teams scoring the majority of their runs in the middle innings of a baseball game. What separate’s the great pitchers from very good pitchers is not only their fastball command or throwing a lot of fastballs but to break up a higher rate of fastballs with a secondary off-speed pitch.
DeGrom did an unbelievable job of using his slider to continually break up his sequence or pattern of pitches. As noted in previous articles, deGrom’s fastball command sets up his secondary off-speed pitches. Fastball command usually allows pitchers to have success even with less command of their secondary pitches but in deGrom’s case, it makes his slider nearly unhittable due to his above average slider command. This was shown last night as deGrom threw 85.7% of his sliders for strikes.
Below I have taken the top five pitchers ranked by ERA over the past four seasons and show their two-seam, four-seam, split-finger and cut fastball combined percentage. Almost all of them throw there fastball more than 50%, some as high as 80% as proof that pitching dominance begins with a fastball:
2014 – Avg. FB % by ERA top 5 – 64.14%
Felix Hernandez – 43%
Chris Sale – 52.9%
Corey Kluber – 80%
Jon Lester – 81%
Garrett Richards – 63.8%
2013 – Avg. FB % by ERA top 5 – 64.6%
Anibal Sanchez – 47.3%
Bartolo Colon – 85.5%
Hisashi Iwakuma – 75.8%
Yu Darvish – 58.4%
Max Scherzer – 56%
2012 – Avg. FB % by ERA top 5 – 62.02%
David Price – 76.3%
Justin Verlander – 55.9%
Jered Weaver – 61.9%
Chris Sale – 60.1%
Felix Hernandez – 55.9%
2011 – Avg. FB % by ERA top 5 – 58.3%
Justin Verlander – 57%
Jered Weaver – 56.8%
James Shields – 51.8%
Doug Fister – 57%
Josh Beckett – 68.9%
2010 – Avg. FB % by ERA top 5 – 61.8%
Felix Hernandez – 60.7%
Clay Buchholz – 54.1%
David Price – 74%
Trevor Cahill – 64.1%
Jered Weaver – 56.1%
Stat of the night: Last night, the Fox Sports Padres broadcast presented the following: DeGrom averages 18.8 seconds in between pitches, 6th fastest among NL pitchers.
ERA information via ESPN.com. Fastball percentage information via FanGraphs.com.


