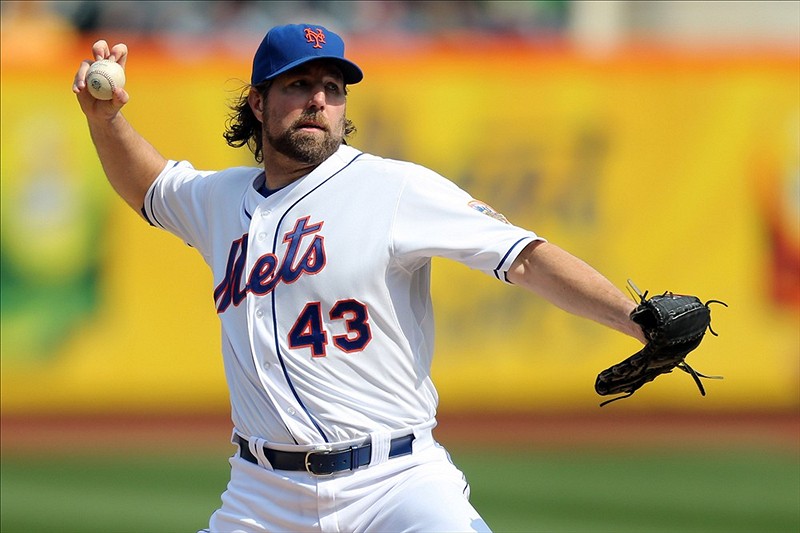
For the most part, Mets fans were pleasantly surprised with the production of the Mets pitching staff in 2012. The bullpen kept us on the edge of our seats the majority of the season, but the starters were one of the bright spots for the Mets. None shone brighter than the ace of the staff, RA Dickey. Some injuries prevented the Mets starting rotation from reaching its full potential, but when all the starters are healthy, it is easily the strongest aspect of the New York Mets. But what will we find out about the Mets Pitchers if we break them down statistically? Statistically speaking, the Mets pitchers may not be as strong as we thought.
The best statistical measure I have come across when evaluating pitchers is the Factor12 (F12) rating. The majority of readers out there are asking, what’s the Factor12 rating? Well, it’s probably best if I let one of the co-creators of the F12 rating explain it to you in his own words:
The Factor12 Rating uses the league average performance to calculate the value of MLB pitchers in a given season. The theoretical average pitcher will have a F12 Rating of 24.000. Elite pitchers will post a 30.000+ seasonal rating. F12 is calculated by comparing each pitcher to the league average in ten ratio statistics, and two counting statistics. – Sven Jenkins
I know. Some of the readers are still scratching their heads. Many are still questioning why this rating is so great. Still not convinced? I will include the entire description of the F12 rating below, so you can get a better feel for why this rating is the best way to analyze a pitcher’s success. You can also find this information on their website:
The Factor12 Rating (F12) is an analytic measurement utilizing league average performance to compare the value of all MLB pitchers.
F12 consists of the following twelve statistics incorporating every aspect of pitching.
Innings Pitched (IP); Strikeouts Minus Walks (SO-BB); Fielding Independent Pitching (FIP); Earned Run Average (ERA); Walks plus Hits per Innings Pitched (WHIP); Home Runs per 9 innings (HR/9); Walks per 9 innings (BB/9); Strikeouts per 9 innings (SO/9); Opponents Batting Average (OBA); Opponents On-Base Average (OOBA); Opponents Slugging Average (OSLG); Modified Base-Out Percentage (MBOP) has been adjusted to include wild pitches and balks.
F12 produces a numeric total value using the percentage difference equation for the ten pre-defined ratio categories. Each pitcher is ranked according to league average performance using 2.000 as the baseline. Categories have a maximum value of 4.000 and a minimum of 0.001.
Percentage difference equals the absolute value of the change in value, divided by the average of the 2 numbers, all multiplied by 100. To illustrate, the average MLB pitcher compiled a 3.94 ERA in 2011. Clayton Kershaw finished his Cy Young campaign with a 2.28 ERA: =((3.94-2.28)/((2.28+3.94)/2))*100. The Factor12 Method adds: /100+2 to utilize an easy number less than, greater than, or equal to 2.000. As a result, Kershaw received a 2.536 F12 value for ERA last season.
The Innings Pitched (IP) and Strikeout Minus Walks (SO-BB) categories utilize a percentage change formula, which does not contain a fixed range. Percentage change represents the relative change between the old value and the new one. For example, the average MLB pitcher totaled 65.75 innings pitched in 2011. Clayton Kershaw compiled 233.33 innings pitched: =((233.33-65.75)/65.75)*100. The Factor12 Method adds: /100+2 and Kershaw earned a 4.549 value for IP last season.
A pitcher’s F12 is the sum of the percentage difference/change value of the twelve statistical categories. The league average performance is 24.000 and the minimum is 0.001. Pitchers recording zero innings pitched will receive a 0.000 F12 Rating. Elite pitchers will accumulate a 30.000+ seasonal rating.
Pitchers completing less than the average yearly innings (i.e. 65.75 in 2011) will have their F12 Rating weighed by the percentage of innings completed in relation to the league average (i.e. Sergio Romo 48 IP/65.75). This adjustment enables starting pitchers and relievers to be compared together based on different workloads for the season.
Factor12 rates yearly performance, with the potential for future projections. Weekly updates were available during the 2012 season to quantify every pitcher in Major League Baseball using F12.
Sounds simple enough right? I think a good way of explaining the F12 rating is by saying that it gives us a better idea of which pitchers actually control the strike zone the best. That’s why I prefer to use the F12 when analyzing pitchers statistically. We can sometimes get caught up in strikeouts, and ERA, but those aren’t always the best ways to analyze how well a pitcher is actually picthing. The F12 rating gives a better overall picture of how a pitcher is performing.
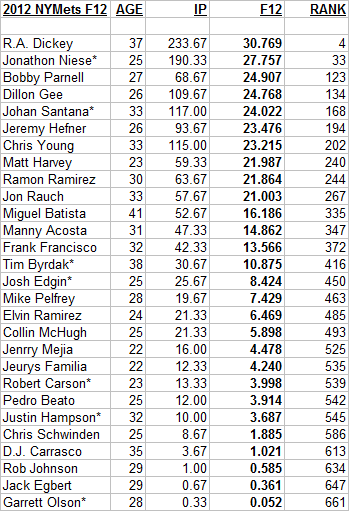
Now that you understand a little more about the rating, and how it works, we can look at how some of the Mets pitchers performed in 2012 by using this rating system. I asked the guys at 60ft6in.com if they could create a spreadsheet of all the pitchers that pitched in a game for the Mets this year. I asked them to provide us with their F12 rating, as well as how it ranked up against every other pitcher in the MLB. Aside from Dickey, you may be surprised about how the other Mets pitchers stacked up against the rest of the league.
I don’t think anyone is surprised that Dickey is at the top of the list for the Mets. Dickey is ranked fourth in the MLB using the F12 rating – only Justin Verlander (31.422), Clayton Kershaw (31.219), and Felix Hernandez (30.914) were ranked higher. Even F12 agrees that Dickey has a great chance at being the 2012 National League Cy Young winner. Something that was surprising to me when looking at the spreadsheet, was that only two Mets pitchers ranked in the top 100. I figured to see more than two pitchers in the top 100. I was also surprised to see that Bobby Parnell, every Met fan’s nightmare, was actually the third best Mets pitcher according to the F12. That kind of leaves a bad taste in my mouth, but I will let it slide.
I can’t be the only person who thought the Mets pitching was pretty good this year (not taking the bullpen into consideration). But according to the F12 rating, they actually weren’t too good at all. The theoretical average F12 rating for pitchers in 24. That being said, the Mets had three average pitchers in 2012 (Parnell, Gee, Santana), one slightly better than average pitcher (Niese), and one elite pitcher (Dickey). The rest of the pitchers were considered below average. It makes you realize how bad the rest of the team must have been in 2012 to make the pitching staff look so good to the fans. However, after a little elbow grease by the guys at 60ft6in.com, and some analysis, we see that the Mets pitching staff is not as strong as it seems.
Regardless of F12, we had some memorable moments from the pitching staff in 2012. Dickey became the first twenty game winner in a Mets uniform since 1990, and is up for the Cy Young award (hopefully some voters check out his F12 rating). Johan Santana maybe injury prone, and average according to his F12 rating, but he pitched the first no-hitter in New York Mets history. When it’s all said and done, the Factor12 can’t measure those things…and those are the things the Mets fans will remember about the 2012 baseball season.
I would like to give a special thanks to Sven Jenkins for taking the time to help out with this article. If any readers want to learn more about the Factor12 rating, or get pitching scouting reports, check out 60ft6in.com. As always, please share any thoughts in the comment section below – was anything surprising to you when looking at the F12 ratings? Do you buy into the F12 rating? Let’s hear it…


