FanGraphs put out their first standings projections for the 2027 season and they project the New York Mets to win the division with an 87-75 record, ahead of the Braves and Phillies who they project to both have an 85-77 record. It feels like we have been here before, doesn’t it?
Why are the Mets projected here, does this mean anything, and what can we take away from this?
Why are the Mets Projected in First Place?
These projections are based off FanGraphs depth charts which looks at the current 40-man roster to project playing time for every player across the season. Recognizing this, it makes sense that the Mets would be ranked so highly.
Whereas the Braves do not have many starting pitchers currently on their roster, the Mets do have a rotation worth of pitchers currently on the 40-man roster. The Phillies meanwhile are missing multiple position players due to free agents leaving whereas the Mets do have a deeper overall system.
Both the Braves and Phillies have very weak farm systems and do not have much upper minors depth so FanGraphs depth charts is projecting a bulk of playing time to come from players who would never have a realistic chance of taking up significant playing time on their rosters.
Currently FanGraphs depth charts projects the Braves rotation to get 68 starts between Bryce Elder, Grant Holmes, JR Ritchie, AJ Smith-Shawver, and Owen Murphy with them combine for 415 innings to a 4.55 ERA and 1.42 WHIP.
For a Mets comparison they are only projected to get 34 starts from their depth of Jonah Tong, Jonathan Santucci, Tylor Megill, Justin Hagenman, and Jack Wenninger with them combining for 198 innings at a 4.09 ERA and 1.35 WHIP. That is almost a half a run better.
The Braves starting five of Chris Sale, Spencer Strider, Didier Fuentes, Spencer Schwellenbach, and Reynaldo López are projected better than the Mets at a 3.73 ERA and 1.22 WHIP, but that is only across 94 starts. For the Mets, Nolan McLean, Christian Scott, Zac Thornton, Sean Manaea, and Kodai Senga are projected to combine for a 3.99 ERA and 1.30 WHIP but across 126 starts.
For the Phillies they project Bryan De La Cruz, Derek Hill, Rafael Marchán, Shay Whitcomb, and Felix Reyes to combine for 1,159 plate appearances to a .230/.284/.382/.666 slash.
For a Mets comparison, Brett Baty, Luis Torrens, Mark Vientos, Ronny Mauricio and Nick Morabito are projected to combine for 1,238 plate appearances with a .242/.306/.409/.715 slash. That is 49 points better in OPS despite being in a less hitter-friendly ballpark.
The Phillies main lineup without the depth mentioned above is projected at a slash of .251/.331/.418/.749 across 4,662 plate appearances while the Mets are projected at .257/.338/.433/.771 across 4,933 plate appearances.
What are the Current Mets Players Projections?
Something very handy FanGraphs does is provide playing time graphics for every team. At the time of writing on November 18 the playing time breakdown was as such.
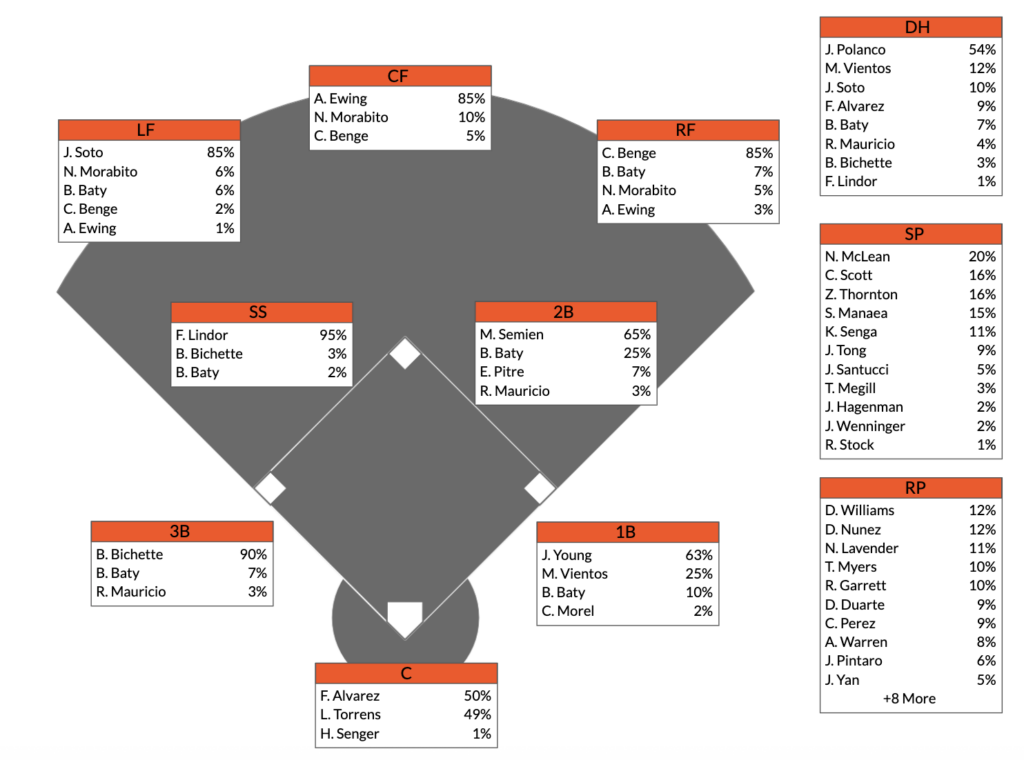
Juan Soto projects to lead the team in home runs, runs, RBIs, walks, OBP, SLG, OPS. and fWAR. Bo Bichette projects to lead in AVG while A.J. Ewing projects to lead in stolen bases.
On the pitching side, Nolan McLean leads starters in innings pitched, ERA, wins, strikeouts, and fWAR. Christian Scott projects to lead in WHIP. Devin Williams projects to lead in saves and Nate Lavender projects to lead in holds.
What Can We Take Away From This?
The Mets have a very good foundation to build from. No, the Mets cannot stay pat and keep an 87-75 50th percentile production. As other teams improve across the offseason they would siphon wins from the Mets if the Mets were not to improve as well. But the Mets can focus more on big fish and supplemental moves due to that foundation.
It is also important to remember what 50th percentile projections actually are. They are the midpoint of all of the simulations run. A team that has higher variance might have a larger range of outcomes even if they have the same 50th percentile as another team. They may have a worse low-end projection or a better high-end projection. Unfortunately FanGraphs only releases the 50th percentile projections.
Overall, the Mets have work to do but they are starting from a good place. They have a strong young core, an owner willing to spend, and more prospects on the way ready to contribute.