Saying the Nee York Mets have had some of the most organizational turnover is an understatement. Whether discussing front office turnover, manager turnover, or coaching staff turnover, the Mets are among the worst. How has turnover impacted success over the last 25 years and how have other factors like payroll impacted it as well?
Data Used
The Baseball Cube is a great source for organizational history. They break out the general manager history, managerial history, and coach history across every team. Cot’s Baseball Contracts lists the Opening Day, year-end, and luxury tax payrolls for every team dating back to 2000. Baseball Reference makes it easy to view year-over-year team records while FanGraphs Leaderboards have the option to split out team stats.

Brad Penner-Imagn Images
Front Office Turnover
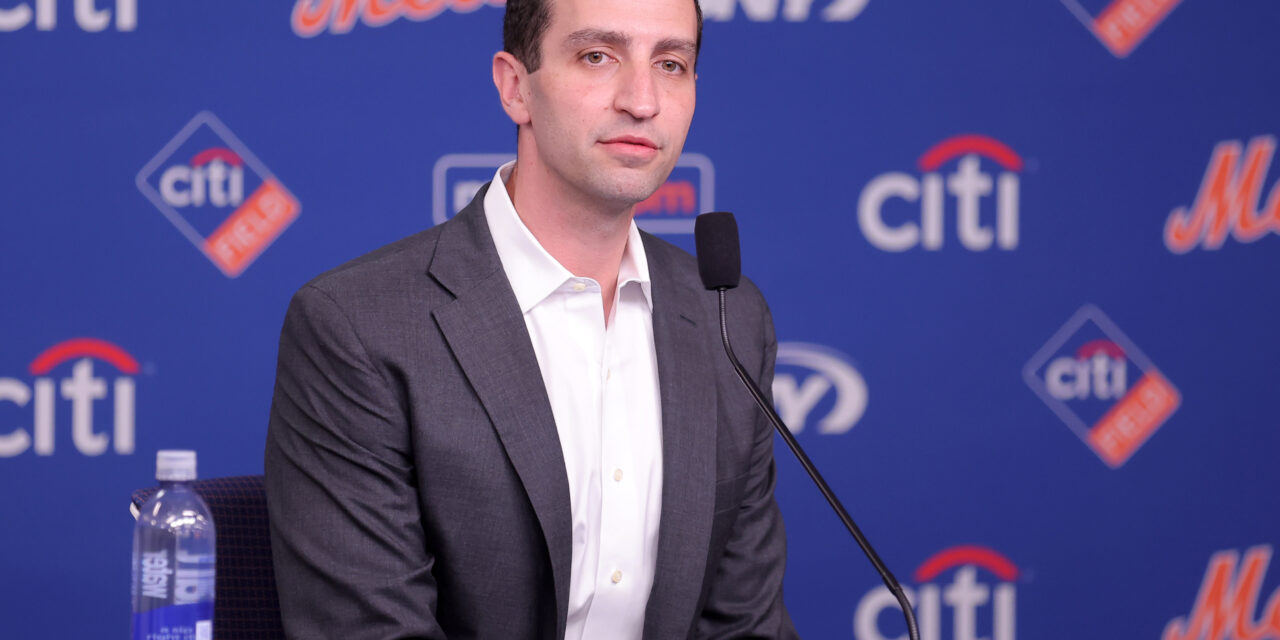
There is not an easy way to get a detailed history of every front office position for every team, so the focus here will be on general managers and president of baseball operations.
Typically, when the lead executive in a front office turns over, they remake the front office in their vision. One notable exception is the current Milwaukee Brewers front office, where Matt Arnold kept in place much of the structure and hires David Stearns had set in place, as written by Will Sammon of the Athletic. Stearns, meanwhile, overhauled much of the organization when he took charge in Milwaukee in 2015, modernizing it into the consistent playoff contender it became.
Over the last decade, the Mets and Los Angeles Angels have had the most turnover with four lead executive changes (with the Mets at most having five if Zack Scott as interim general manager is included). Over the last 25 years, they have also had the most turnover with seven lead executive changes (eight including Scott).
Only the Boston Red Sox and the Houston Astros have had close to the Mets’ level of front office turnover and had sustained success. The other teams in line with the Mets over the last 25 years include:
- Cincinnati Reds (5) – .471 win percentage (W%) and five playoff appearances
- Miami Marlins (5) – .464 W% and three playoff appearances
- Baltimore Orioles (5) – .458 W% and five playoff appearances
- Washington Nationals (5) – .476 W% and five playoff appearances
The Mets are at a .498 W% with five playoff appearances. On the other side you have:
- New York Yankees (0) – .581 W% and 20 playoff appearances
- Athletics (1) – .511 W% and 10 playoff appearances
- St. Louis Cardinals (2) – .548 W% and 15 playoff appearances
- Cleveland Guardians (2) – .518 W% and 10 playoff appearances
- Chicago White Sox (2) – .475 W% and four playoff appearances
The White Sox are the clear outlier there, with their 100-loss seasons during their rebuild. Of the top-15 teams in terms of front office stability, 10 of them had a record over .500 over the last 25 years and 13 of them made the postseason at least six times.
Looking at the last decade, the Mets line up with:
- Los Angeles Angels (3) – .455 W% and zero playoff appearances
- Colorado Rockies (2) – .431 W% and two playoff appearances
- Miami Marlins (2) – .441 W% and two playoff appearances
- Cincinnati Reds (2) – .458 W% and two playoff appearances
- San Francisco Giants (2) – .499 W% and two playoff appearances
The Mets are at a .508 W% with three playoff appearances. On the other side, you have:
- Los Angeles Dodgers (0) – .621 W% and 10 playoff appearances
- New York Yankees (0) – .574 W% and eight playoff appearances
- St. Louis Cardinals (0) – .523 W% and four playoff appearances
- San Diego Padres (0) – .491 W% and four playoff appearances
- Cleveland Guardians (1) – .556 W% and seven playoff appearances
The Padres are the outlier here with three poor seasons at the top of that decade. Since 2020, they have a .544 W%. Of the top-15 teams in terms of stability, nine of them have winning percentages over .500 and 10 of them made the postseason four or more times.

Mark J. Rebilas-Imagn Images
Manager Stability
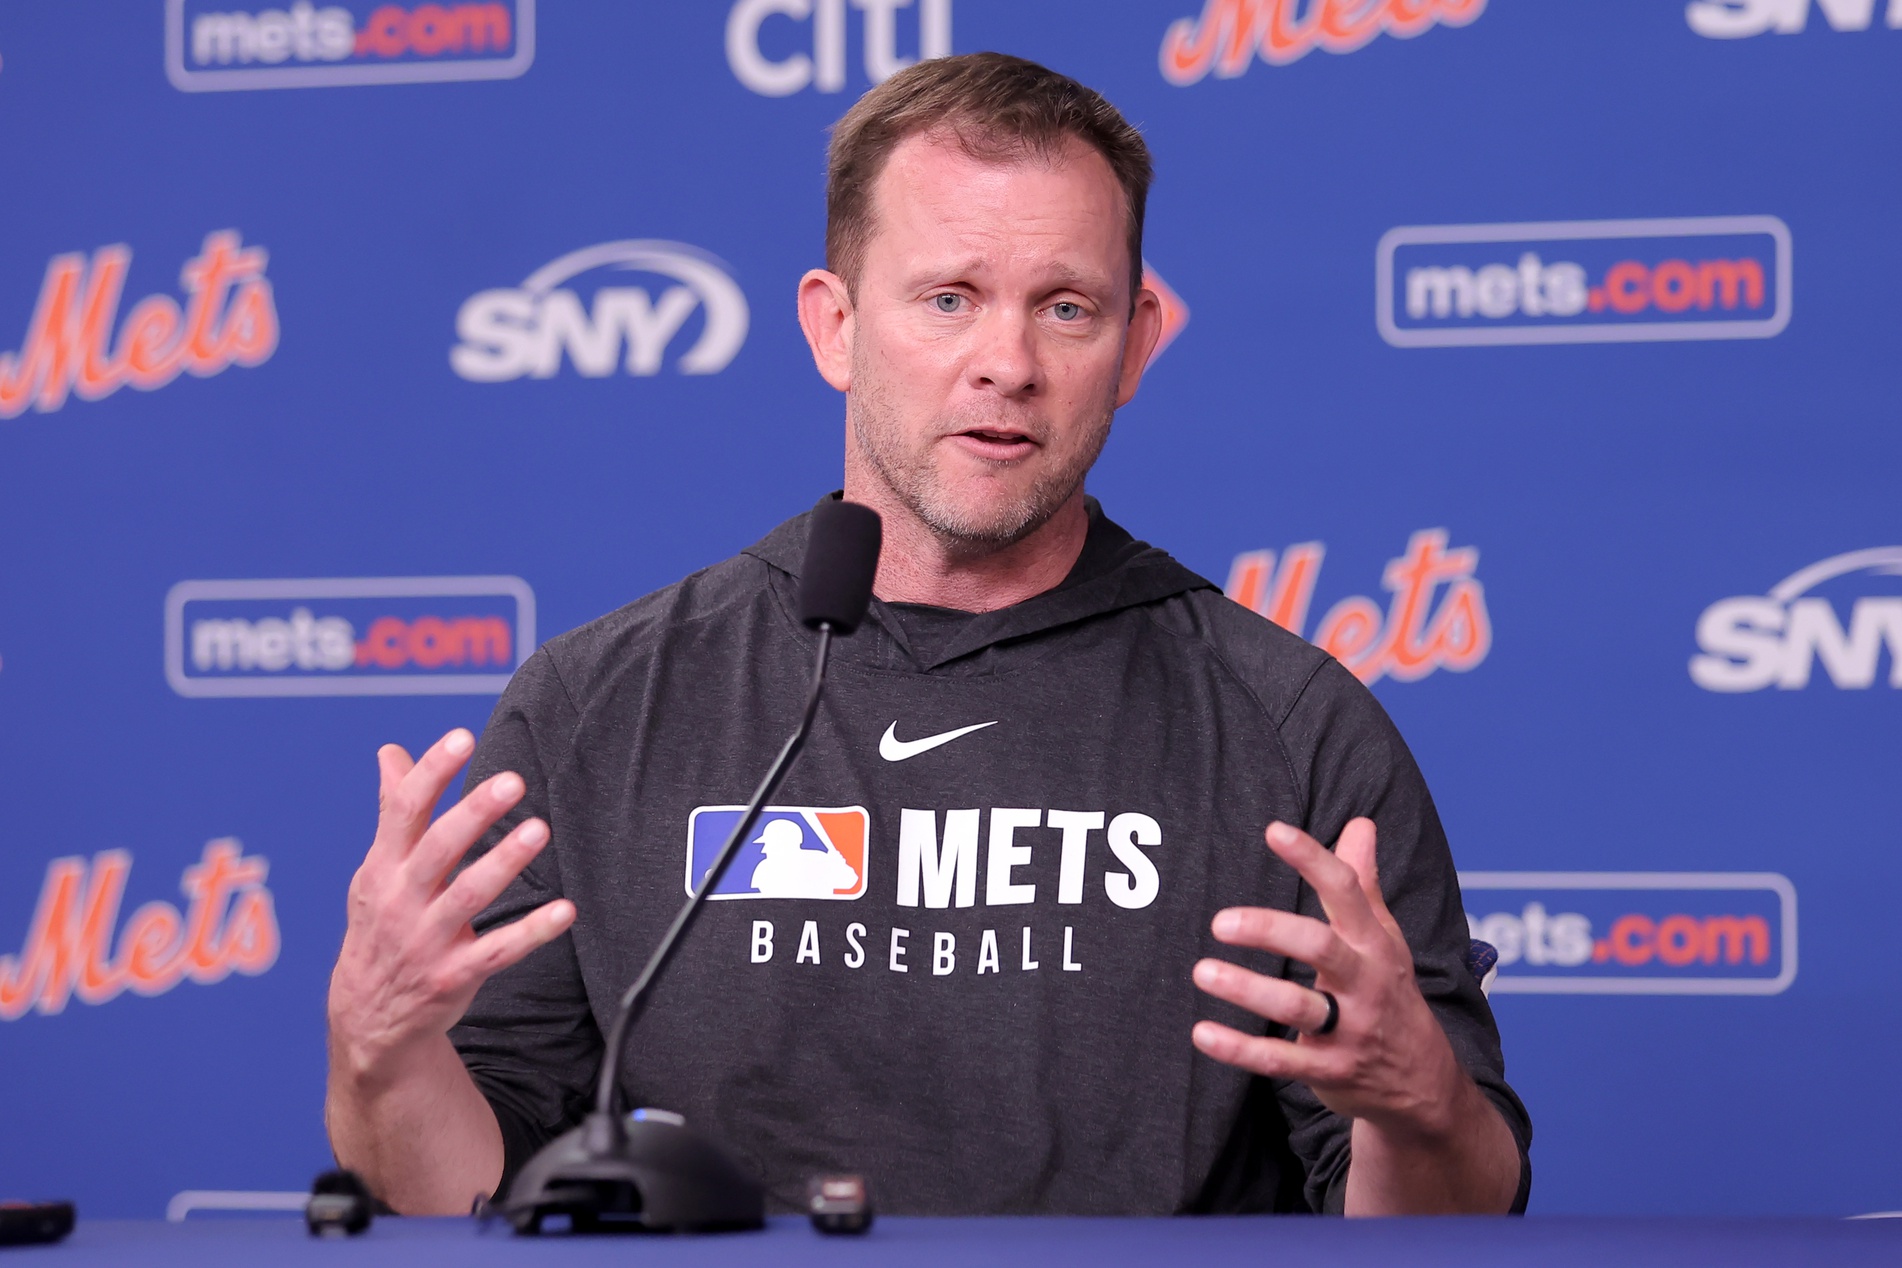
The Mets do not have the most manager turnover the last 25 years, but they are tied for the fifth-most with the Cubs and Royals and behind the Marlins, Astros, Nationals and Marlins. Of that group only the Marlins have fewer playoff appearances than the Mets.
Over the last decade only the Angels have churned through more managers than the Mets who are tied with the White Sox.
When you look at the teams with manager stability you have over the last decade:
- Tampa Bay Rays (0) – .538 W% and five playoff appearances
- Los Angeles Dodgers (1) – .621 W% and ten playoff appearances
- New York Yankees (1) – .574 W% and eight playoff appearances
- Cleveland Guardians (1) – .556 W% and seven playoff appearances
- Atlanta Braves (1) – .541 W% and seven playoff appearances
And the last 25 years:
- New York Yankees (2) – .581 W% and twenty playoff appearances
- Atlanta Braves (2) – .541 W% and fifteen playoff appearances
- St. Louis Cardinals (3) – .548 W% and fifteen appearances
- Minnesota Twins (3) – .503 W% and ten playoff appearances
- San Francisco Giants (4) – .516 W% and seven playoff appearances
Of the teams that have had significant manager instability (nine changes or more over the last 25 years) only the Houston Astros and Chicago Cubs have a record over .500. Over the last decade for teams with four changes or more only the Mets and Phillies do.
Brad Penner-Imagn Images
Coach Stability
There are a few ways to look at coach stability. The first is to aggregate the staff as a whole, the second is to split by coach.
It may not be surprising but the Mets have had the third-most coach turnover of the last decade behind only the Seattle Mariners and the Los Angeles Angels. Over the last 25 years only the Mariners had more turnover. As expected, teams that had significant coach turnover routinely had poor records and regularly missed the playoffs.
When looking at hitting coaches specifically the Mets had the fourth-highest turnover with only the Angels, Padres and Marlins higher while over the last 25 years they were the sixth least stable behind the Padres, Diamondbacks, Cubs, Mariners and Marlins.
They have had more pitching coach stability with Jeremy Hefner staying with the club from 2020-2025. Overall, they are middle-of-the-pack over the last decade at 17 as well as over the last 25e years at sixteen.
Where Have Mets Staff Gone After Leaving?
The role a member of the Mets’ organization has after leaving the club gives insight into how the industry views them. Jeremy Hefner left the Mets and made a lateral move to the Braves. This says he was viewed by the industry a capable coach, though maybe not enough to earn a promotion to a higher position. Eric Chavez meanwhile has been unable to find a job in baseball after leaving the Mets.
Over the last 25 years not a single Mets general manager has served as a general manager for another team after leaving the team. Jim Duquette did serve as a vice president of baseball operations in the Orioles front office while Sandy Alderson, Omar Minaya, and Billy Eppler took senior advisor positions with other clubs, but none have served as a general manager.
Of the Mets’ managers, over the last 25 years, only Bobby Valentine ever managed a game again. Luis Rojas and Carlos Mendoza recently did get coaching jobs after leaving the Mets, but both took demotions to base coach jobs. Both are relatively young and could manage some day in the future, but it has yet to happen.
Despite having some of the highest manager turnover over the last 25 years, no other Mets manager over that time period managed in the majors again after leaving the club.
Of the Mets coaches (excluding manager) the Mets coaches overall did worse than the other 29 teams in finding equal jobs or promotions after leaving the club.
On average 14.5% of Mets coaches left in a lateral move compared to 19.6% for the other 29 teams while only 13.2% were promoted compared to 19.8% from the other 29 teams. 61.8% were not on a coaching staff within two seasons compared to 53.9% from the other 29 teams.
Mets hitting coaches fared the best with 31% getting lateral roles compared to 26% from the other 29 teams and 15% getting a promotion compared to 9% for the rest of the league.
Steve Cohen. Photo by Ed Delany of Metsmerized
What Can We Learn From Stability
The first question to ask is: do teams struggle because they have turnover, or do they have turnover because people get fired when the team underperforms?
It would make sense that if a team is consistently changing front offices and philosophies that lack of consistency will impact their ability to build a sustainable organization. If you are consistently losing staff to other organizations you are losing that institutional knowledge with them.
On the field changing coaches significantly can impact hitters negatively as the information players are receiving is changing, as well as the way they are receiving it. It makes sense that over the last 25 years the Mets had the eighth-best ERA, as that as that is one of the areas they have had the least turnover. Whereas the hitting coach position has had more turnover and they rank eighteenth by wRC+.
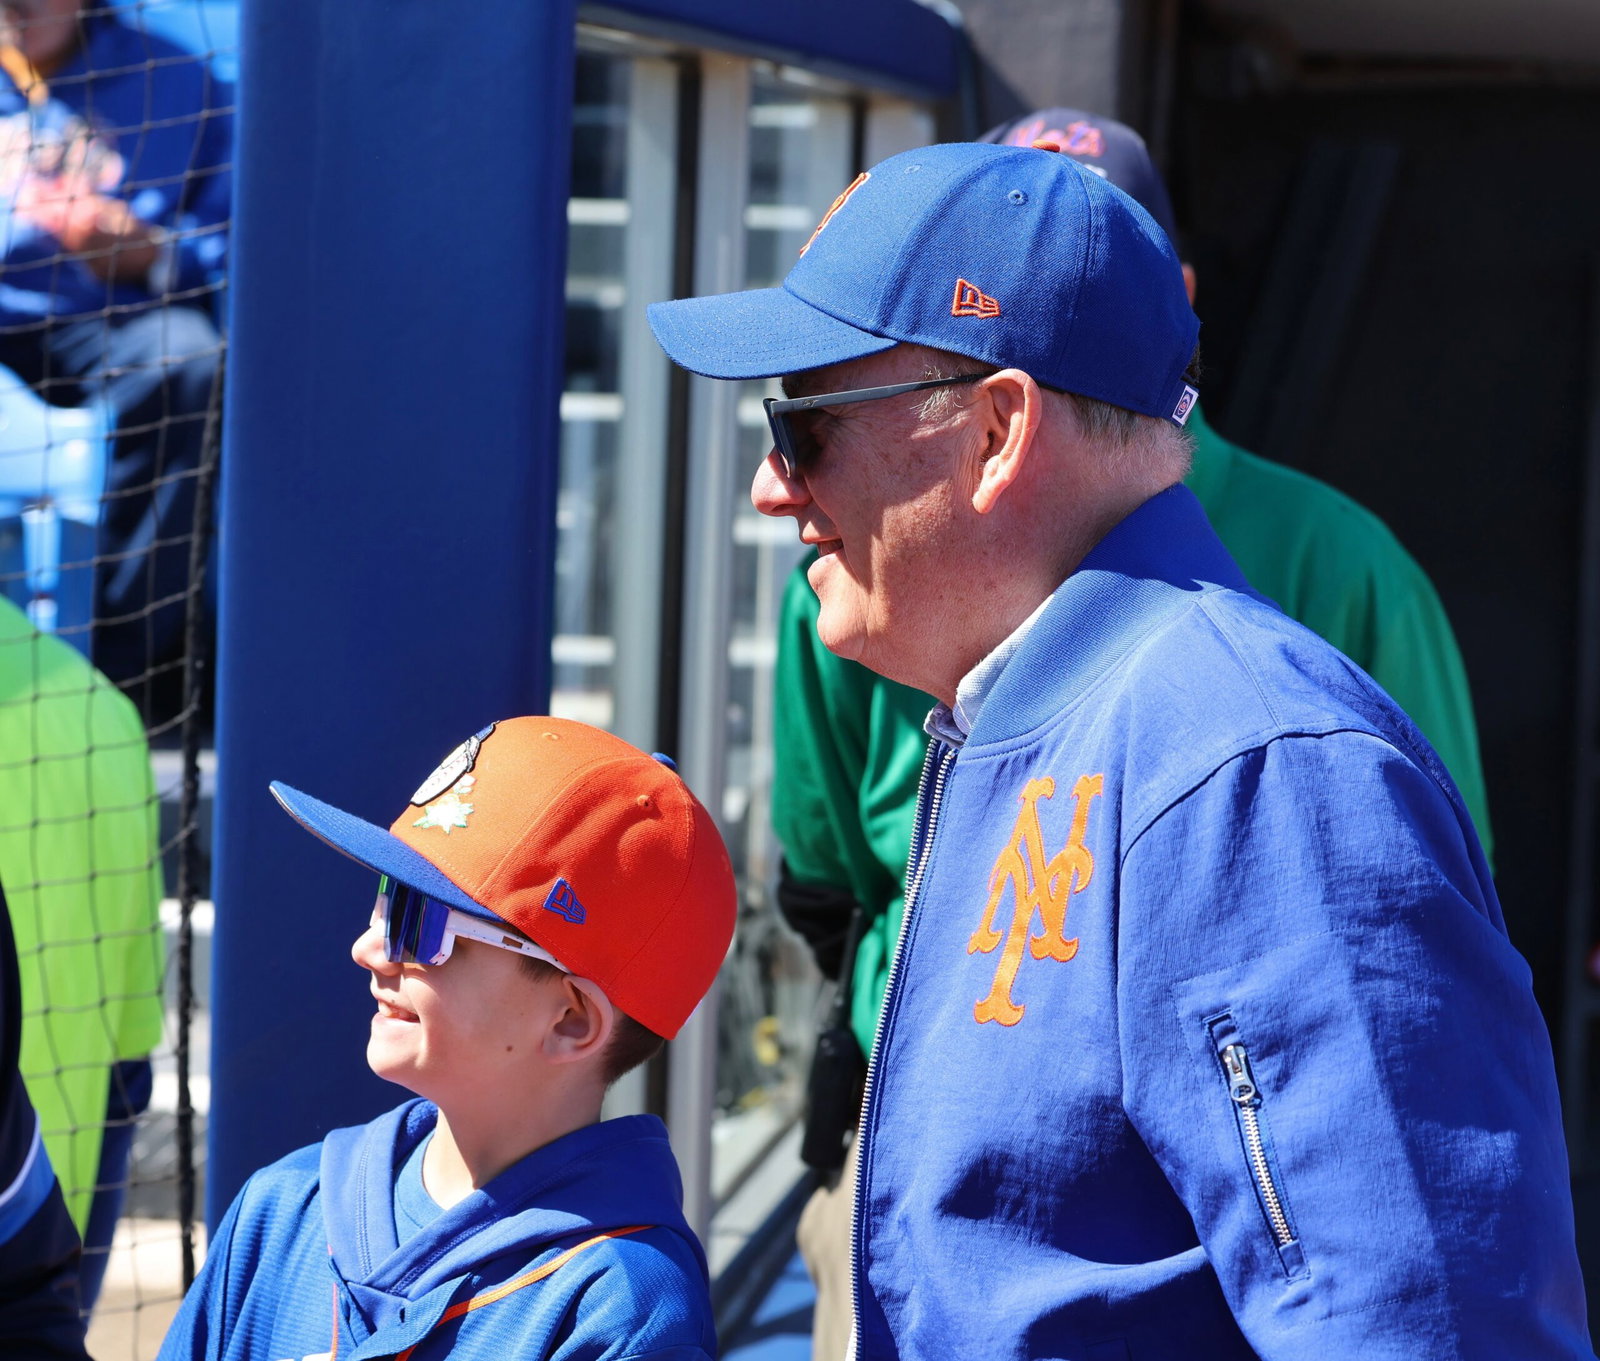
Payroll can help with instability. The Mets’ winning percentage since Steve Cohen took over despite significant turnover and staff churn is at .513. They have made the playoff in two of those six years (33.3%). In the 19 years before that it was a .490 W% with three playoff appearances in 19 seasons (15.8%). While at times it may not feel like it, in the small sample of the Cohen era they have had better overall results than what came before and he has utilized his wealth to try to paper over deficiencies in the organization.
The Boston Red Sox and Philadelphia Phillies are two other teams that have had significant turnover and have utilized high payrolls to make up for it.
On the other side, many low payroll teams with stability like the Brewers, Rays, Athletics, and Guardians have had sustained success while the low payroll teams with instability like the Diamondbacks, Nationals, Reds, Orioles, and Royals have not. The exception to this are the Pirates and Rockies, but their coaches overall performed well below average in terms of finding lateral jobs or promotions, with 70% of Pirates coaches and 61% of Rockies not working on coaching staffs within two seasons.
The Verdict
Stability makes building sustainable organization with continued success a much higher probability as long as you are staffing it with the right individuals. If an organization regularly sees their staff leave and not get a comparable role within two years, that is a sign they are not hiring the right people.
Payroll can paper over this to an extent, but organizational stability is the clearest path to success. The Mets have tried to build a winner where the owner shuffles through front offices and coaches like a deck of cards and most Mets fans would likely say that it has not worked to the level they want. If this current iteration of the front office is not the one to get it done, the next one needs to be.
If the Mets want to have success, they need more stability in the organization than they have had over the last decade, and the last 25 years.
| Position | Last 10 years | Last 25 years |
|---|---|---|
| POBO/GM | 30 | 30 |
| Manager | T-29 | T-26 |
| Bench coach | 30 | 30 |
| Hitting coach | T-27 | T-25 |
| Pitching coach | T-17 | T-16 |
| First base coach | 28 | 30 |
| Third base coach | T-22 | 25 |
| Bullpen coach | T-21 | T-27 |
| All six coach slots | 28 | 29 |