If I had to pick one position player from the National League East to anchor a lineup for a year, David Wright may just be my pick. While on the field, the 31 year-old had a monster 2013 season, one that was cut short by a pesky hamstring injury. Wright fell short of 500 plate appearances for only the second time in his career, but still managed to hit 18 home runs and steal 17 bases, as well as put up a slash line even better than his 2012 version.
Wright is not going anywhere. 2013 was his best season, pound-for-pound, since 2008, even better than last season. While his totals are deceiving, he hit more home runs per plate appearances than 2012 and would have hit three more had he stayed on the same pace and received the same number of plate appearances.
Besides his hamstring injury, which hasn’t resurfaced, Wright left no doubts about his 2014 season. Almost every facet of his game was as good as its ever been. His power is back and about as good as it’s going to get with Citi Field’s dimensions. His ISO, a measure of power (SLG-BA) was .207 in 2013, 21 points higher than the previous year and the highest it has been since 2010.
With the glove, Wright couldn’t match what he did in 2012, at least according to the metrics. His 17.4 defensive runs above average in 2012 was most likely a statistical anomaly and a product of the sheer number of innings Wright manned the third base slot. In 2013, he was 5.4 runs above average, still better than his typical career numbers, especially given the smaller sample size. Either way, it’s safe to say he is probably a better fielder than he was at the beginning of his career, as evidenced by both the defensive metrics and the video.
This year should be an interesting one for Wright. I honestly don’t see the fear of his getting injured. Really, his probability in his prime, having only two completely unrelated major injuries in his career, of getting hurt is the same as the average player. Two injuries in three years? Maybe I would reluctantly put the “injury prone” tag on him if I could see a correlation between the injuries, but I just can’t. Obviously it’s impossible to project injuries which is why this projection series doesn’t do it, but the odds of Wright getting hurt again are not especially high.
While on the field this year, Wright is likely going to have another season close to his 2012 and 2013 campaigns. There are no danger signs with Wright here, no real indicators that he’s destined for a sharp drop in production. His BABIP last season at .340, although high for a typical player, is right on his career numbers, as was his home run per fly ball rate.
The most most direct indicator for Wright has been his strikeout numbers. When he has struggled, it has been while his strikeout rate was high. The past two seasons, he has approached the level of the pre-Citi Field David Wright in this regard, punching out in 16.1% of his trips to the plate, down from 24% in 2010. We are witnessing Wright return to his peak production levels, even with some external factors limiting some of his numbers. As the following chart from Fangraphs will show you, while Wright is streaky, he is averaging a much better strikeout rate than he has in the past.

If Wright can keep this up, his decline should be a slow and gradual one. If he descends into his old ways, it won’t be so sow. However, the past two years have given no real indication that this will happen, so Wright continuing this trend is a good bet.
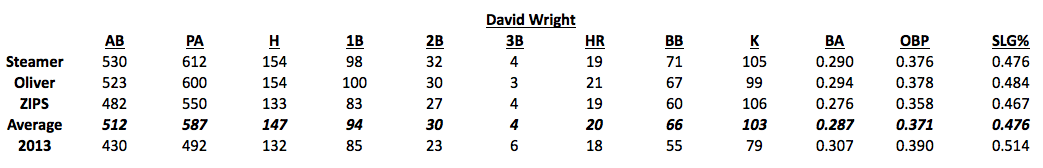
Finally, to the projections. The Steamer, Oliver, and ZiPS systems all have Wright in a sharp decline, and it’s easy to see why. For one, the age curve on these systems doesn’t fit all players. For durable players like Wright, the decline will be much less steep than what the computer projections tend to say. In addition, the defensive metric trend of the past two years, combined with the age, may lead the computers to think that he is going through a decline. However, as we mentioned before, the defensive metrics from two years ago, although Wright was fantastic in the field, are an overestimation. 2013 was more of a correction, which is why the systems see a decline in that category, which brings down his WAR significantly. Steamer has a +2.4 runs above average mark on defense for Wright net year, while Steamer has -0.8 runs and ZiPS at +2.9. I’m certainly taking the over on this one.
Overall, Wright is on a path that will please Mets fans this year. This may be the annual spring optimism talking, but the stats point towards another great year for the captain as his team inches toward playoff contention.
2014 Projection
650 PA · 23 HR · .310/.395/.505 · 25 SB
11.0 BB% · 16.5 K% · 7.5 fWAR


