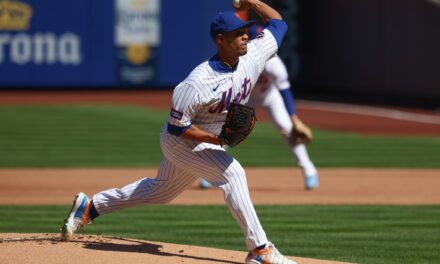
 A year ago, all the talk surrounding David Wright involved his long-term future with the club. A few down years in a row made people start to wonder if we would ever see the David Wright of old (circa 2006) ever again. Would the Mets re-sign him? Would they sell low and flip him for prospects? Well, a year later, he not only had a bounce-back season, but also secured his long-term future in New York by signing an eight-year contract, the most expensive in Mets history.
Wright had a down year in 2011, and was plagued by a stress fracture in his back for almost the entire season. He had hurt himself in mid-April, and wasn’t really the same again, hitting .231 over the last two months of the season while showing little in the way of power. In all, he finished the year with career-low marks in batting average (.254) and OPS (.771) with just ten home runs and 61 RBI in 102 games. Fans weren’t too high on him as his expectations (and value) hit a career-low. A great season for David was in the best interest of both him and the club. If he had a good season, he could cash in with a big contract, and the Mets would have the option to trade him and get a respectable package in return if they so desired.
Wright started off the season hot, hitting .394 with a 1.064 OPS over the first month of the season. He continued to hit well, batting .347 in May and .340 in June, with MVP talk heating up. Could he stick with the Andrew McCutchens and Buster Poseys of the world and compete for the batting title? The answer was no. Wright’s production took a turn for the worse after the All-Star break.
Over the second half of the season, Wright was far less productive, hitting a shade under .260 with a .750 OPS. His strikeout rate shot up again and his walk rank dipped. He was almost reverting back to his 2009-2011 self. The power was still there, but he was striking out more often. We’ve seen time and time again that if his strikeout rate goes up, his production goes down.
You can see that in his best years, his strikeout rate has been well below 20%. The past few years, however, it’s been well above that mark.
As usual, before I make a projection, I want to put it in context by showing you two other respected projections. One, ZiPS, is a very conservative computer projection. It doesn’t take into account injuries or playing time, but it gives a rather pessimistic view most of the time. On the other side, we have the Bill James projection, which is much bolder. Here’s what they both project Wright doing this season:
ZiPS: .274/.357/.449, 19 HR, 85 RBI, 18 SB
James: .302/.392/.488, 21 HR, 94 RBI, 16 SB
I think we have some reason to believe that last year’s second half for Wright was just a slump, and something that he will get over. He showed last year that he is becoming more selective again and laying off the inside pitch. Check out this chart from Fangraphs, comparing Wright’s “down years” from 2009-2011 and two of his “good years” (2008, 2012):
His selectivity was what made him very successful from 2004-2008 and is still the key to him producing now. The fact that he was more selective last year is a very good sign, and has me optimistic for Wright this season. While I highly doubt he will produce like he did in April and May, he will, in my opinion, have another quality season in 2013.


